Pronóstico
Forecasting helps you visualize your project’s progress based on tracked time. See how you’ve performed on recurring projects for a set time period and make predictions based on scheduled assignments and add estimates or budget to see if the project will go over or under them.
El pronóstico es una función adicional, disponible solo para administradores. Puedes habilitarlo actualizando tu espacio de trabajo al plan Pro o Empresarial.
Crear gráfica #
- Ve a la página Proyectos en la barra lateral
- Selecciona la pestaña de Pronóstico
- Selecciona la fecha o período de tiempo en el futuro
Cada punto del eje X mostrará el valor del período de tiempo específico que hayas seleccionado (día, semana, mes).
Día: El valor del eje X está en días y cada punto de la curva muestra el valor por día.
Semana: El valor del eje X muestra toda la semana para cada punto.
Mes: El valor del eje X muestra todo el mes para cada punto.
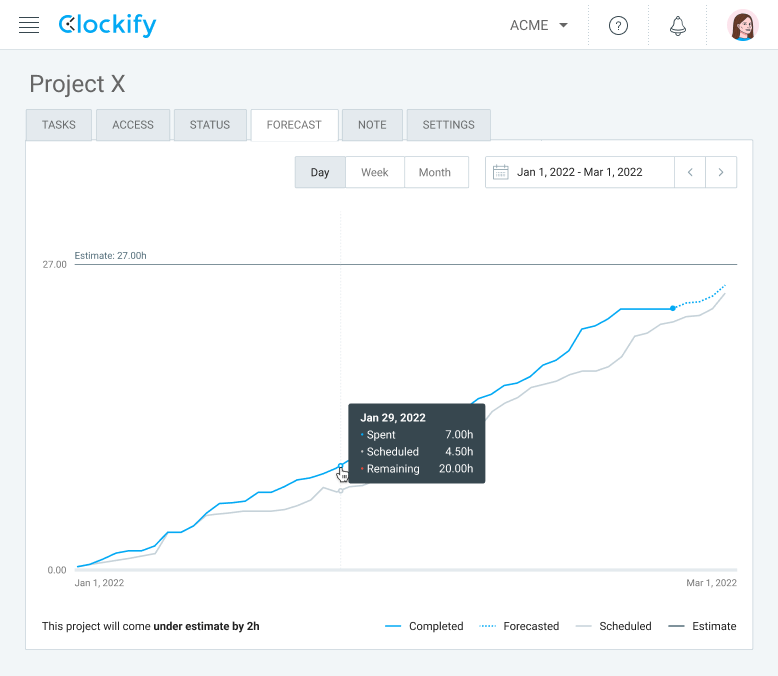
Pronóstico de finalización de proyecto #
La gráfica muestra la finalización del proyecto basándose en la estimación del proyecto y las horas fichadas.
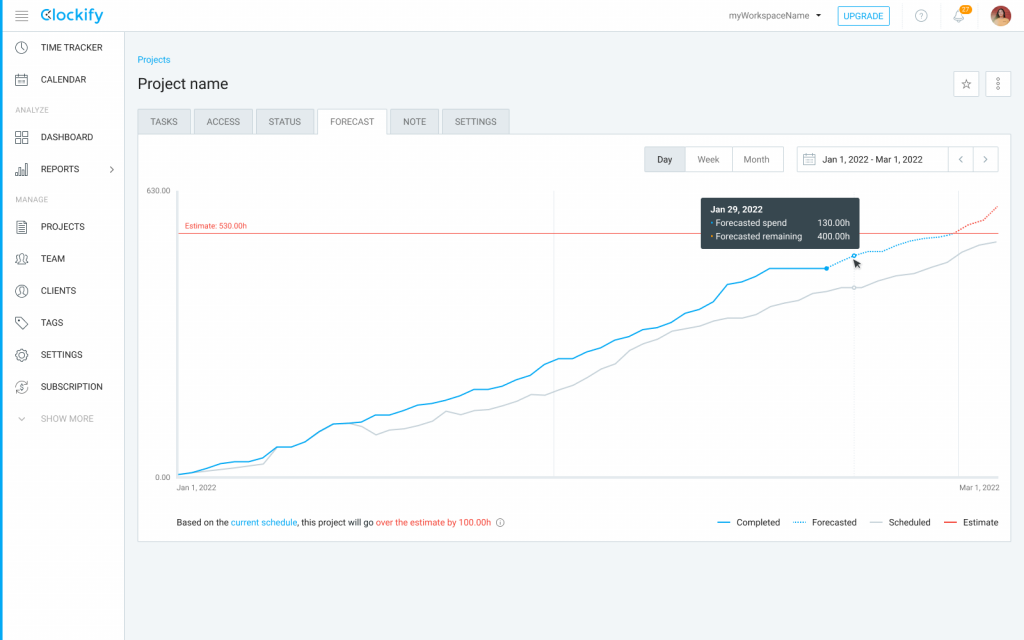
Terminado (línea azul continua)
Muestra las tareas terminadas según el tiempo facturable rastreado hasta el momento, es decir, todo lo terminado hasta el día de hoy.
If estimate reset is turned on, first point is 0, but last point is set in defined period (week, month, year).
Pronosticado (línea azul punteada)
Shows completed tasks based on billable tracked time plus future scheduled billable time. It starts with Today, which means that the Forecasted curve starts where the Completed curve ends. If it goes over the estimated horizontal line, the part of the curve that is over the estimate will be in red.
If estimate reset is turned on, first and last point are set in defined period (week, month, year).
Programado (línea gris continua)
Muestra las tareas terminadas según las horas facturables programadas en este proyecto. Esta curva está conectada a la función de Planificación y toma las asignaciones planificadas para el valor del eje Y (número de horas programadas).
If estimate reset is turned on, then first and last point of the line need to be in the defined period (week, month, year).
Estimación (línea gris horizontal continua o línea roja horizontal continua si los proyectos sobrepasan la estimación)
Shows completed tasks based on estimate in project settings.
If estimate reset is turned on, then first and last point are in the defined period (week, month, year).
If project estimate reset is set on a specific time of the day:
- entries and assignments are always placed based on their start time: e.g. Weekly reset is set for today, 2pm. Assignment is scheduled from 12pm-6pm. The assignment is assigned to the first half of the day, which belongs to the previous week. This week’s time range is from 2pm today to midnight and there is no assignment in that period.
- midnight is automatically assigned if assignment doesn’t have start time (belongs to the first part of the day)
- today’s dot on the chart always belongs to the Forecasted line: e.g. Estimate reset is set to 2pm, so the first part of the day belongs to the previous week, however, it will still have a forecasted value for that dot until today is over
Si se selecciona semana/mes en el selector de período y Hoy se incluye en el período seleccionado, todo hasta Hoy es terminado y todo después de Hoy, hasta el final de la semana/mes es Planificado. Por lo tanto, las horas rastreadas de Hoy se incluirán en el total de tareas Completadas después de la medianoche, en tu zona horaria.